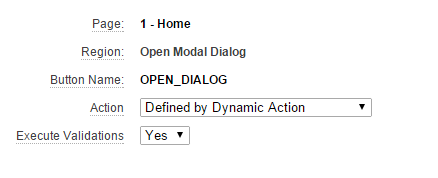
The task was basically to highlight certain cells in an interactive report based on the values in another column. While the highlighting feature in the interactive report is great that's one thing you can't do with it. You have the choice of highlighting the whole row or the cell in the column on which you based the condition. Another situation where the builtin highlighting isn't enough is when you need some complex conditions involving more than one column.
Took some iterations, but here's one solution to this.
I'll first outline the building blocks and then explain how they work together including some failed attempts on the way getting to this.
Interactive Report Query:
SELECT empno,
       ename,
       job,
       mgr,
       hiredate,
       sal,
       comm,
       deptno,
       CASE WHEN sal <= 1500 THEN 'data-style="background-color:green"'
            WHEN sal > 1500 AND sal <= 3000 THEN 'data-style="background-color:orange"'
            WHEN sal > 3000 THEN 'data-style="background-color:red"'
            ELSE NULL
       END css_style
  FROM emp
Then set the css_style column to hidden and set the "HTML Expression" attribute on the column you want colored to something like the following.
Note: I use the SAL column here, but you can really use any column.
HTML Expression of column SAL:
<span #CSS_STYLE#>#SAL#</span>
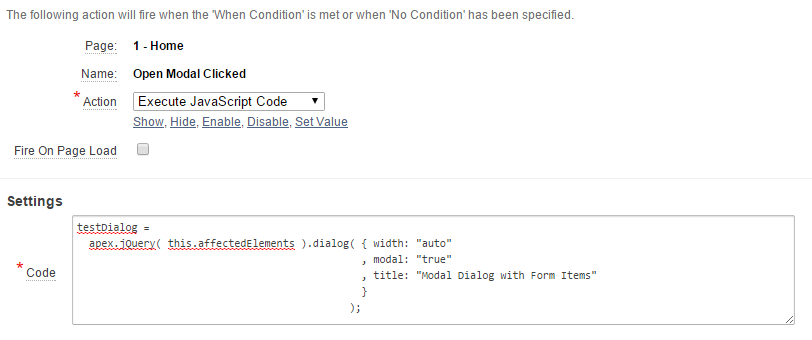
The last bit is some JavaScript code which you put into a dynamic action firing on event "After Refresh" for the interactive report region. Make sure to also set "Fire On Page Load" to yes, otherwise you have no coloring after page load.
JavaScript Code:
apex.jQuery("span[data-style]").each(
  function()
  {
    apex.jQuery(this).
      parent().attr( 'style'
                   , apex.jQuery(this).attr('data-style')
                   );
  }
);
If you don't want to read the full story you can stop reading here and have a look at the example app to be found at https://apex.oracle.com/pls/apex/f?p=83537.
Still reading?
Let's take a look at how we got to a working solution and how it does it's magic.
In the query we are laying the foundation by adding a column which computes the needed style for us. You might wonder why there is "data-style" instead of simply "style". Let me show you how the report would look if you would just be applying a style to the span element.
 |
| Just styling the span element |
This doesn't look good and the reason is that the span element is an inline element only using the space it needs and not filling all available space as block elements do. Next try would be setting the span element to behave like a block element by adding display: block to the style definition.
 |
| Styling the span element with added display:block |
Back to the "data-style" thing. You are allowed to add your own custom attributes to HTML elements if you prefix them with "data-". Browsers will ignore them but from JavaScript or in this case jQuery you can access and utilize those attributes.
Let's have a closer look at the JavaScript code and walk through the logic.
- Select all span elements which have an attribute called data-style
apex.jQuery("span[data-style]") - Loop through the jQuery array and call an anonymous function for each item
.each( function() { - Find the current item's parent element (that's the for the cell)
apex.jQuery(this).parent()
- Set the parent's style attribute using the span's data-style attribute
.attr('style', apex.jQuery(this).attr('data-style'))

So long folks, this post actually got longer than I expected.
Happy IR-Hacking :-)